By deploying the QLACK LGTM stack you get the following components and features out of the box:
-
OpenTelemetry Collector
Runs as a DaemonSet and accepts OTLP traces, metrics, and logs from your applications on ports 4317 and 4318, while also collecting host, kubelet, and cluster metrics.
-
Grafana Loki
Scalable log storage and querying. Logs ingested by the collector are exported to Loki for fast, label-based searching across your services.
-
Grafana Mimir
Prometheus-compatible, long-term metrics storage. Metrics collected from your applications and infrastructure are exported to Mimir for reliable querying.
-
Grafana Tempo
Distributed tracing backend. Traces are exported to Tempo, enabling end-to-end request drilldown and root-cause investigation.
-
Grafana & Dashboards
Grafana ships pre-configured with Loki, Prometheus/Mimir, and Tempo datasources and a built-in QLACK OTEL-LGTM Observability Overview dashboard set as the home page.
-
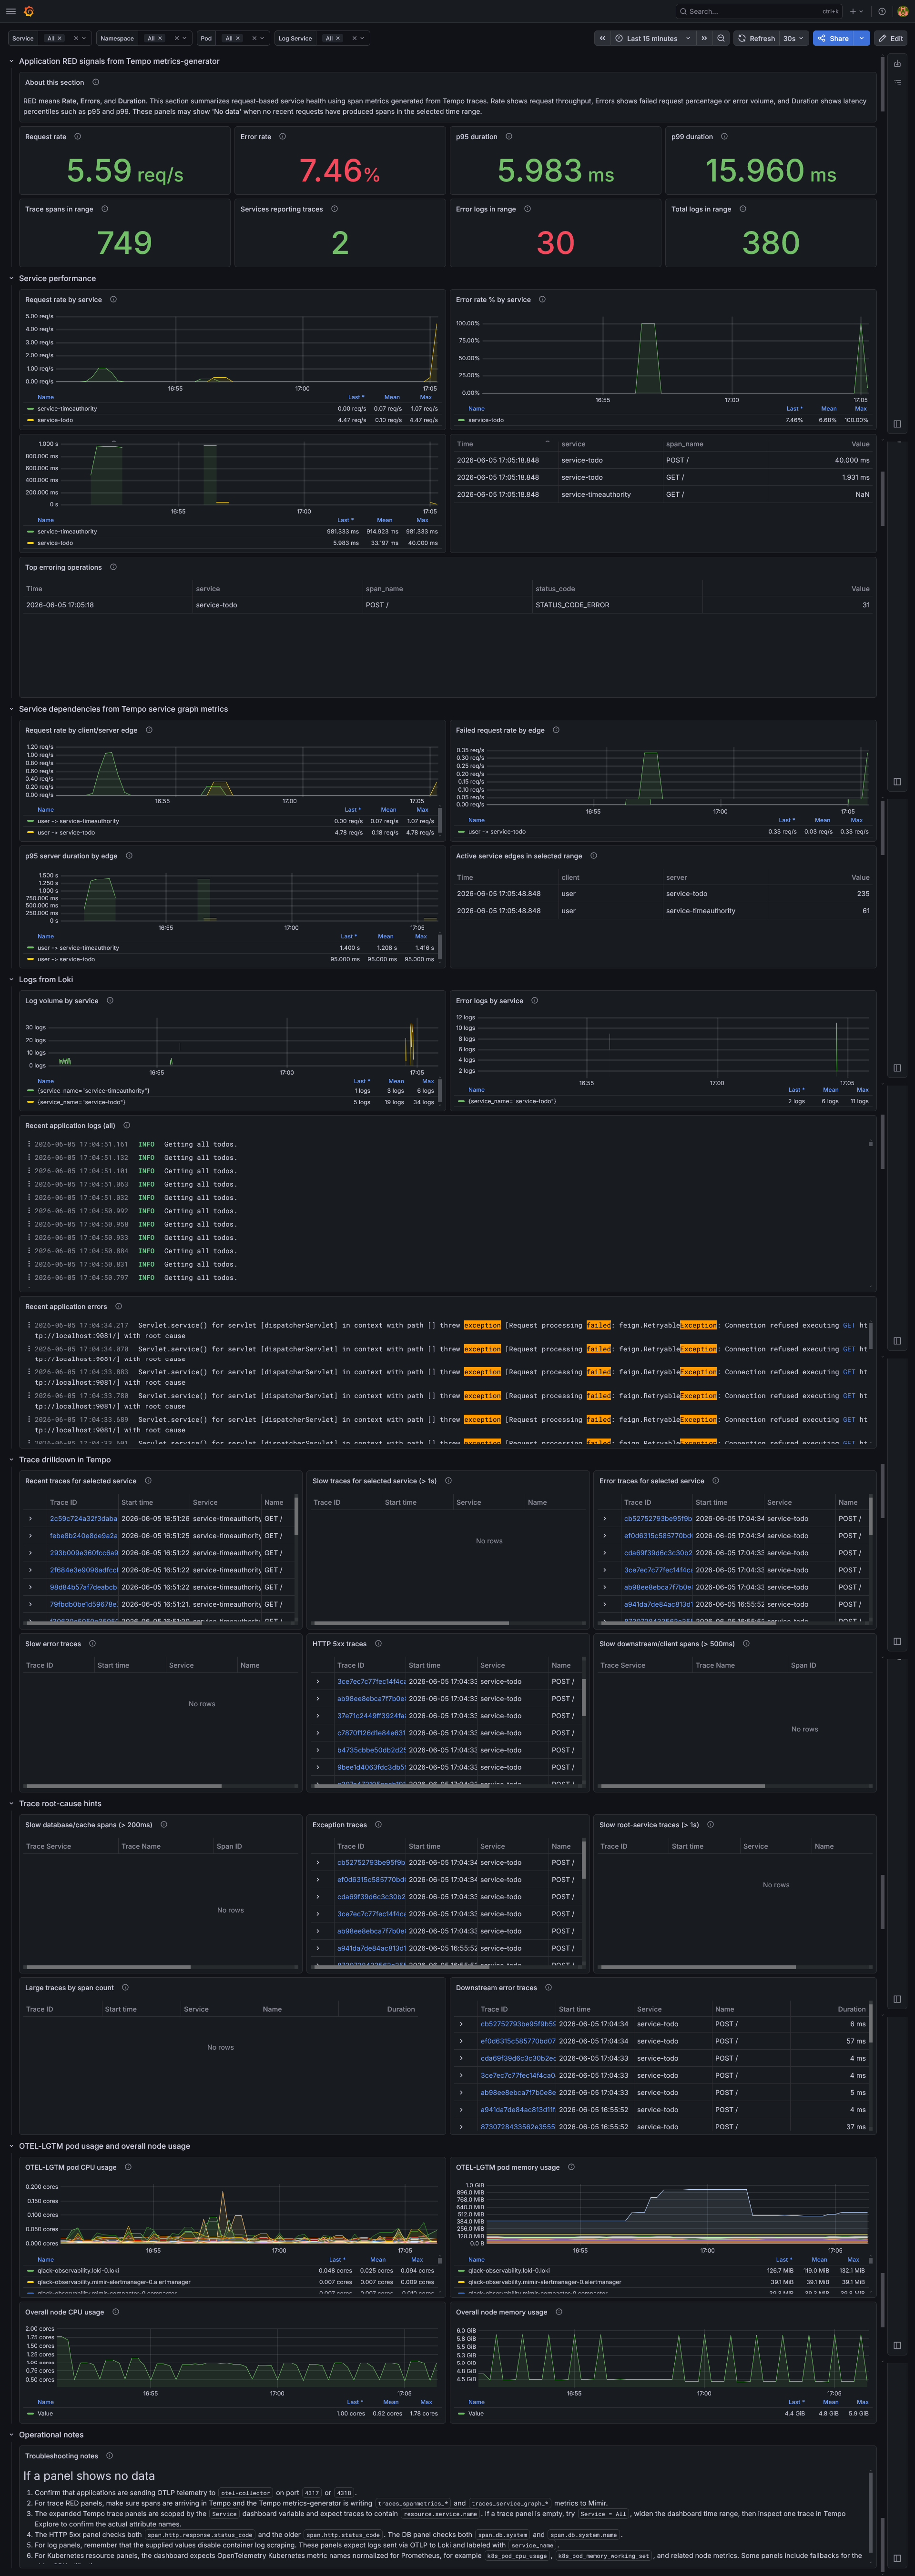
Application RED Signals
Rate, Errors, and Duration summaries derived from Tempo metrics-generator span metrics, including request rate, error rate, p95/p99 latency, and trace/log counts.
-
Service Performance
Per-service request rate, error rate, and p95 duration over time, plus tables of the slowest and most error-prone operations.
-
Correlated Telemetry
Metrics, logs, and traces are correlated in a single view, letting you pivot from a metric spike straight to the related error logs and traces.
-
Quick Deployment
Packaged as a single Helm chart for Kubernetes 1.20+ and Helm 3.x, the whole stack can be installed and wired together with a single deployment.
See QLACK LGTM in action
QLACK LGTM ships with a ready-to-use Grafana dashboard that combines metrics, logs, and traces into a single troubleshooting experience for Kubernetes workloads and OpenTelemetry-instrumented applications.